

The big puzzles of economic development
Lecture notes, class 1

I periodically teach a class on law and economic development targeted at masters level public policy students, law students and advanced undergraduates. I am going to post a few of my lectures, which are write-ups of my slides for the class. This first lecture motivates the class. I tell students that the class will focus on the first 3 puzzles, but that they should explore the remaining 3 on other classes.
The main puzzles of economic development
This class focuses on 3 problems of development. But there are 3 others you should know and perhaps explore in other courses. The problems this class tackles are:
1. Why did economic growth, defined as total global output of goods and services or output per capita, and population explode around 1800?
Since Homo sapiens first arose, roughly 200,000 years ago, the species has grown slowly relative to modern times. Both population and income per capita has been close to constant. Then roughly around 1800, there was what we now call the Industrial Revolution and both population and per capita incomes exploded. (See the figures below.)
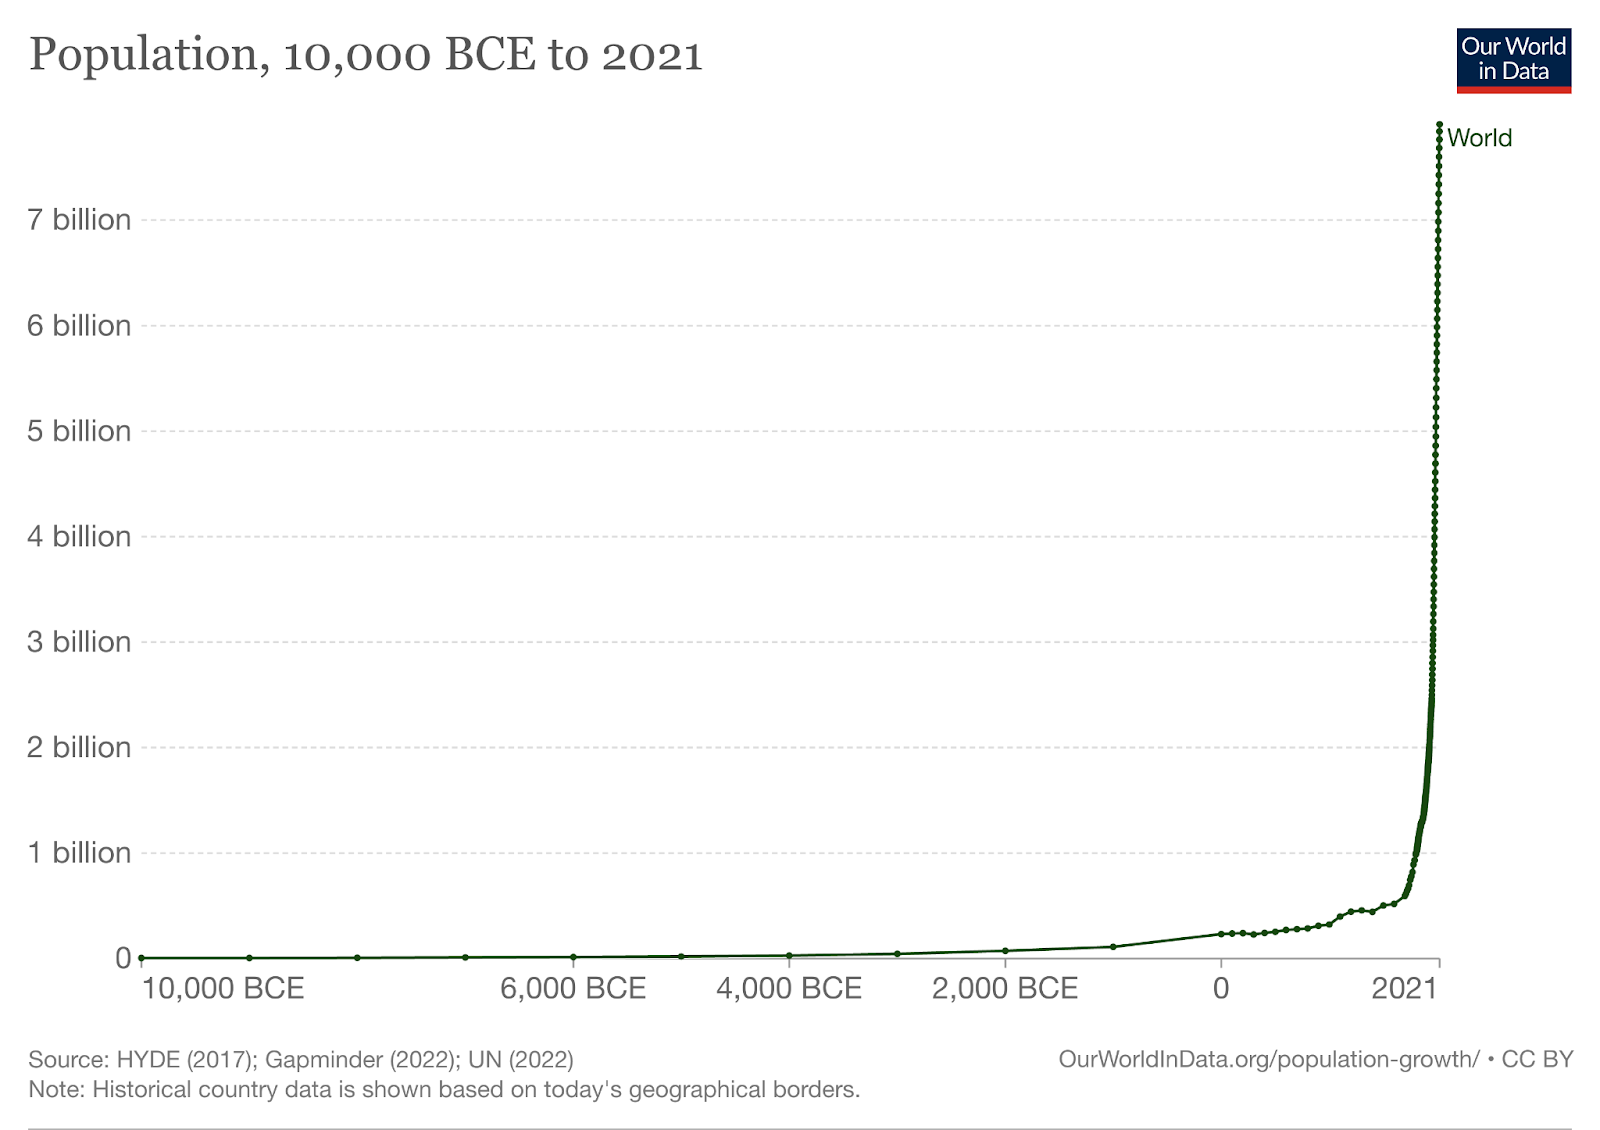
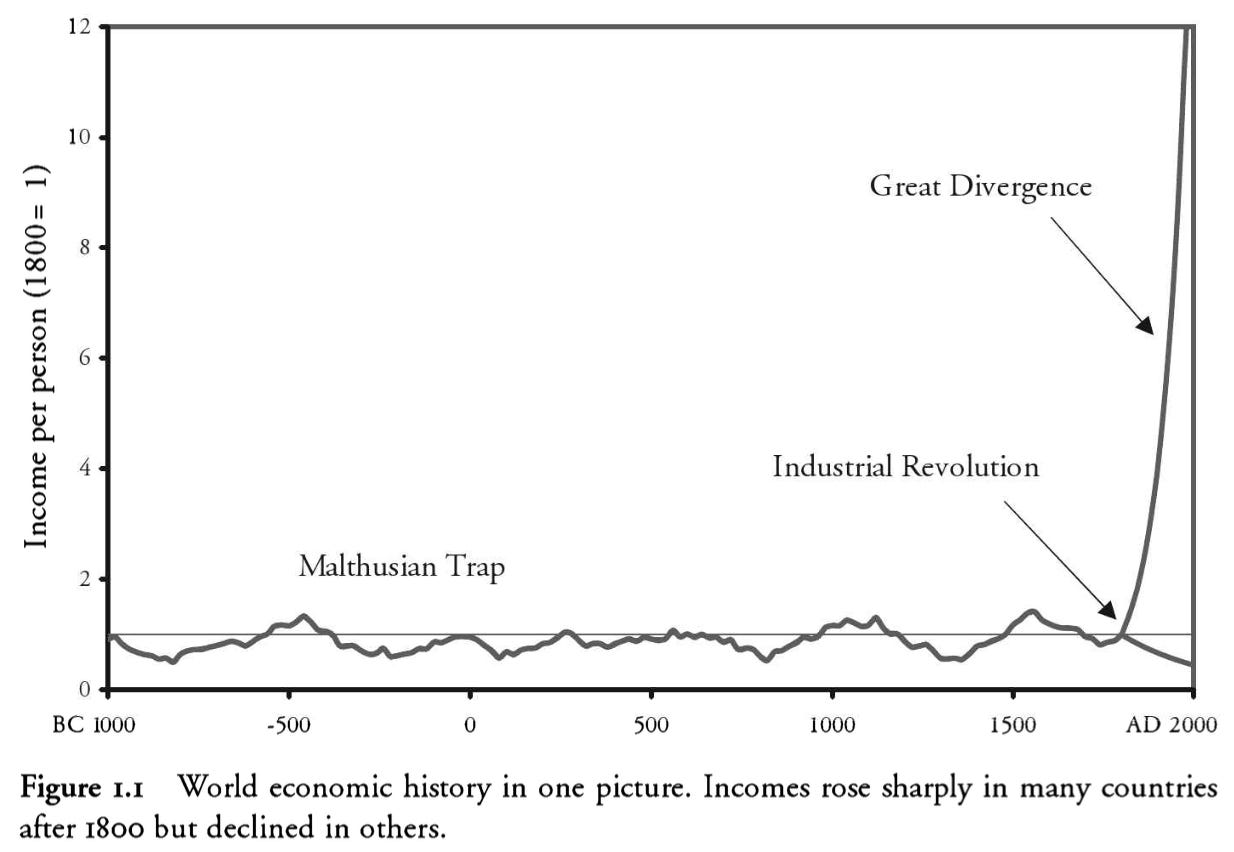
Note: The subplot on the top is from Our World in Data (OWID) (https://ourworldindata.org/economic-growth). The subplot on the bottom is Figure 1.1 from Clark, G. 2008. A Farewell to Alms: A Brief Economic History of the World (Princeton University Press).
Question: An important skill you should have to develop in this class is to understand graphs. Whenever you see a graph, try to explain to yourself what the x-axis is, what the y-axis is, what the units of each are, and what the main message is. Then ask yourself why the graph is presented in the manner it is and if there would be a better way to convey the message. For example, in the figure to the right above, why is the y-axis presented as an index rather than, say, dollars?
It is hard to relate to the idea that we live in miraculous times. In the US we worry about recessions and low growth rates relative to, e.g., China. It is sometimes hard to imagine things could be worse. But if human history were to fit into one day, all but the last second or so would involve basically no growth. As Greg Clark puts it “the average person in the world of 1800 was no better off than the average person of 100,000 BC” {Clark, 2008 #6094} (p. 1). Compared to that, the United States average 2% growth over the last 150 years, a rate that doubles our per capita income every 36 years, is a continuous miracle.
Before the Industrial Revolution, humans lived in a Malthusian economy, named after the economist Thomas Malthus, the first person to describe its dynamics. Humans live like non-human animals: whatever resources (i.e., calories) were available, we treated as manna from heaven and divided amongst ourselves. The total daily population was equal to the number of calories available divided by the amount required in a day to subsist.
The big change in the Industrial Revolution was that instead of being takers, humans became creators. Instead of each new human (on average) taking resources away from other humans, each new human was (on average) producing more than she consumed. This happened because humans began to innovate, producing new tools and social organizations that increased the consumption they could extract from Earth’s finite resources. We entered a so-called neoclassical economy where humans created additional output, which begat more humans, a cycle that made possible exponential economic growth.
2. Why is there inequality across countries? What are recent trends? What are the historical causes?
The Industrial Revolution began in England but spread to the rest of the world. But this process was uneven. Countries that start an exponential growth process later will lag behind those that started it earlier. (See the top figure below.)
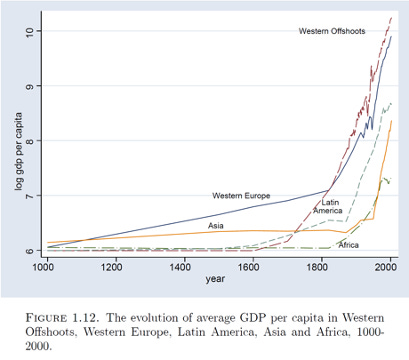
Notes. From Acemoglu, Daron. 2008. Introduction to modern economic growth (Princeton University Press).
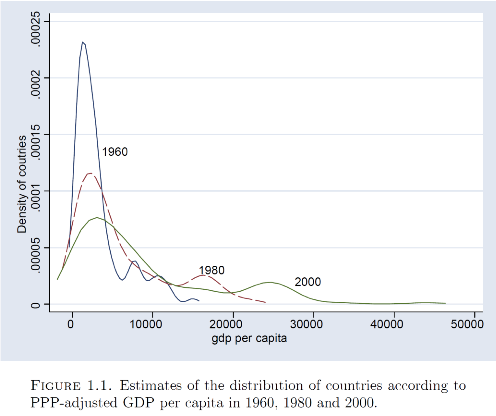
As a result, some countries are far richer than other countries. In 2021, the per capita income in the US was $70,480, roughly 43 times the $1,610 per capita income in Malawi. (These numbers are adjusted to achieve purchasing power parity (PPP), meaning they account for the fact that prices of, e.g., food are lower in Malawi.) The bottom figure above shows that, from 1960 to 2000, the gap between countries grew dramatically. In Malthusian times all countries were similarly impoverished. Today, no country lives in Stone Age conditions, but some countries live like kings and queens and others like commoners.
3. How do we explain the recent 40-year stretch of growth in China? Why didn’t India, which also grew substantially during this period, match China’s performance? What implications does it have for policy?
Although the growth in inequality across countries may stand out in the last figure, hidden within that figure is a massive decline in extreme poverty. Notice that the mass of countries with low incomes in 1960 declines and moves to the right by 2000. The decline of global poverty is even more obvious in the left figure below. Extreme poverty fell by almost 75%, from 2 billion to 750 million, in the last 30 years! There are 2 countries that are largely responsible for this progress: China and India. In 1990, they had 1.2 billion people living in extreme poverty. By 2019, those numbers were just 130 million.
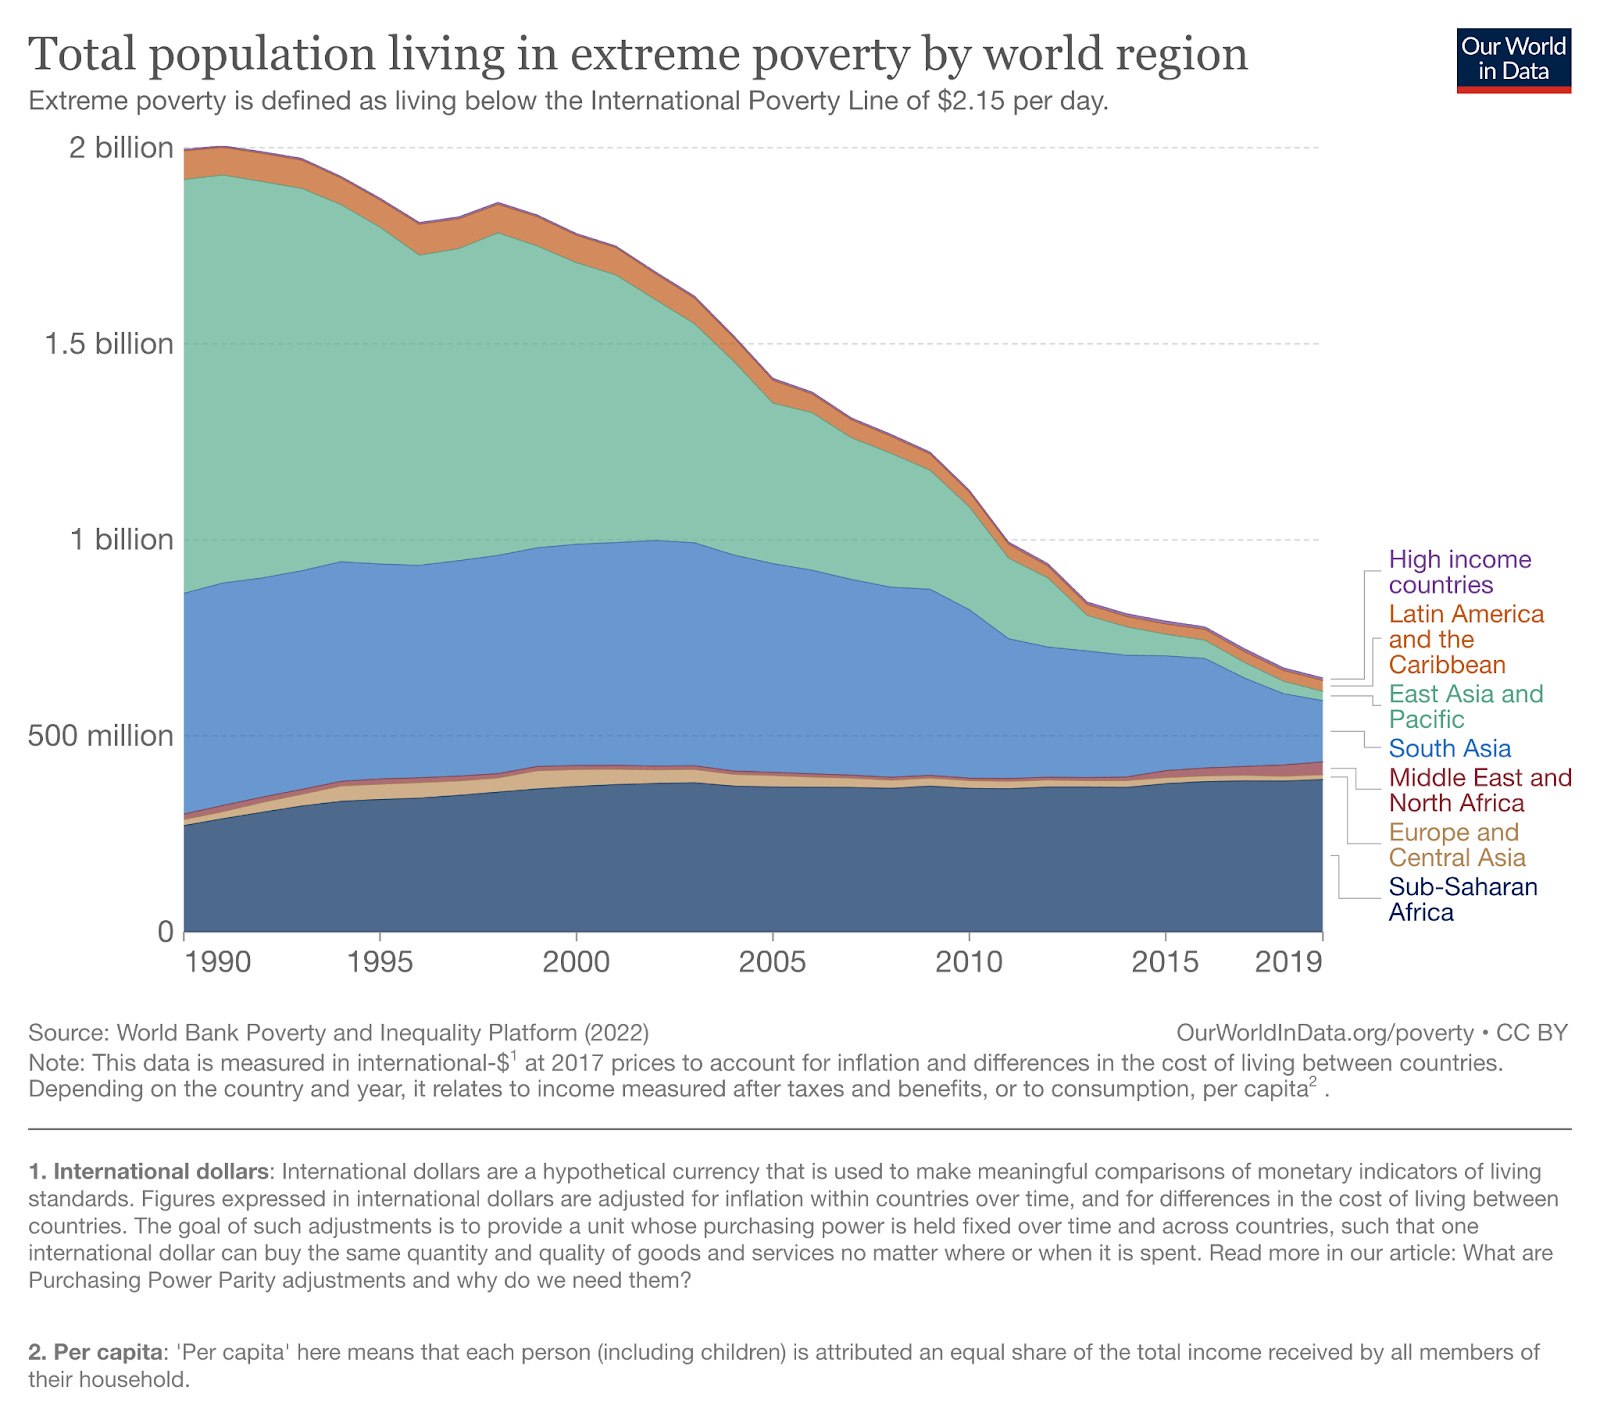
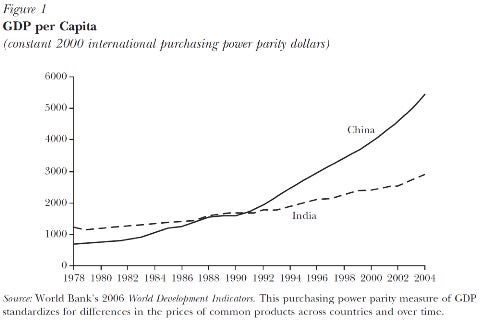
Notes. Top subplot is from OWID (https://ourworldindata.org/grapher/total-population-living-in-extreme-poverty-by-world-region). Bottom subplot is from Bosworth, Barry, and Susan M. Collins. 2008. 'Accounting for Growth: Comparing China and India', Journal of Economic Perspectives, 22: 45-66.
But progress in those countries was not identical. After the Cultural Revolution, China was much poorer than India when Mao died in 1978. Deng ushered in reforms that began a 40-year path of unprecedented rates of economic growth. By the end of the 1980s, India shook off its so-called Hindu rate of growth and it too began a 30-year period of remarkable growth. But as the right figure above shows, China’s pace was faster and longer than India’s. As a result, by 2021, China’s per capita income was $19,160, while India’s was just $7,130.
To these 3 central puzzles that motivate this course, I want to add three more:
4. Why is there inequality across individuals across countries? Why is there inequality within countries?
So far we have compared the performance of countries. But it is not obvious that that is the correct unit of analysis. Many people quite reasonably care instead about individuals. So a natural question for those concerned about inequality is: what has happened to inequality across individuals globally?
This is a different issue than what has happened to inequality within, say, the US or India. There is plenty of focus on within-country inequality. But that is only a part of the puzzle. Within country analysis ask, e.g., how much has the top 1% grown versus the bottom 50%. But the actual purchasing power-adjusted income of the top 1% in Malawi may be lower than the bottom 50% in the US! Because total global inequality across individuals is equal to inequality between countries plus inequality within countries, within-country inequality is an important input into global individual inequality, but not the only thing that matters – in part because of my point about percentiles not being comparable across countries.
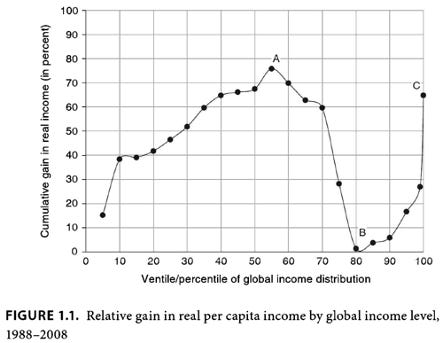
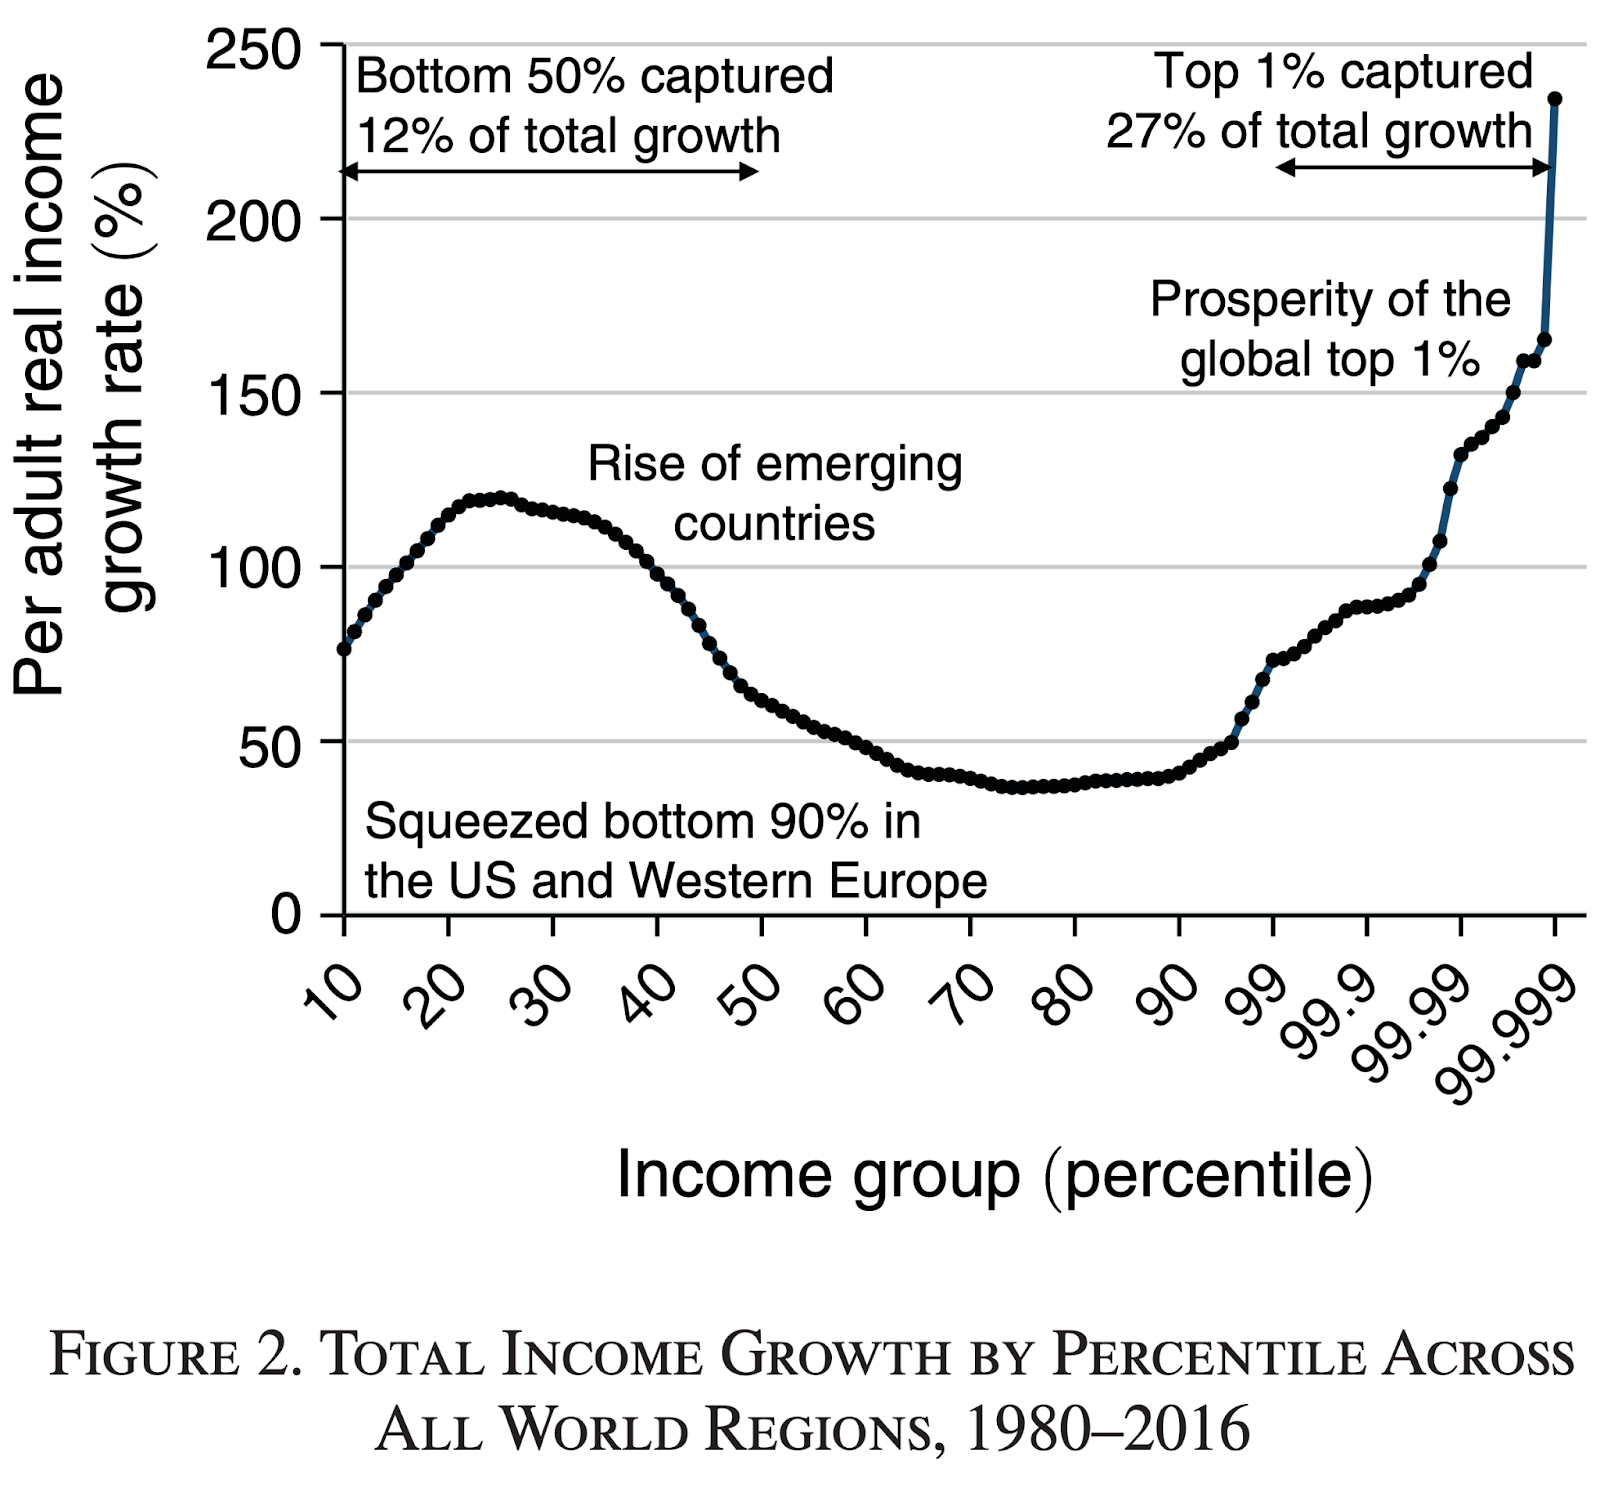
Notes: Top subplot uses 1980-2008 data from household surveys and is from Milanovic, B. 2016. Global Inequality: A New Approach for the Age of Globalization (Harvard University Press). Bottom subplot uses 1988 - 2018 data from the World Inequality Database and is from Alvaredo, Facundo, Lucas Chancel, Thomas Piketty, Emmanuel Saez, and Gabriel Zucman. 2018. 'The Elephant Curve of Global Inequality and Growth', AEA Papers and Proceedings, 108: 103-08.
The left figure above – the so-called “elephant curve” – explains the puzzle of individual inequality. The x-axis has percentiles of global income distribution across individuals. The y-axis is the GDP growth rate. The figure says a few things. First, as you move up the income ladder, from the bottom 5th percentile to the 55th percentile globally, growth increases. The implication is that the bottom 50% of the world population is experiencing greater inequality over time: the 10th and 50th percentiles are growing further apart. Second, as you move from the 55h percentile to the 80th percentile, there is convergence, i.e., those two percentiles are moving closure together and inequality between them is falling. Finally, as you move from the 80th percentile to the 100th percentile, we see divergence again, with a substantial portion of the divergence occurring within the top 1%.
The right figure above uses slightly more recent data from a different database. It gives both good news and bad news. The good news is that global inequality is falling, perhaps to the lowest level since the 1700s. Not that growth is falling from the 25th percentile to the 80th percentile. This means income of people at those two levels is converging! The bad news is that the top 1% globally is being pulled even further apart.
Question: Let me reiterate again that we are not looking at inequality within the US – but across the world. To put the figure above in perspective, ask yourself: where in the global income distribution is a household that earns the median income (~$75,000 in real terms in 2021) in the US? As a follow-up question: ask yourself where you would lie if you lived at the federal poverty level for a family of 4 ($30,000 for 2 adults and 2 children). (This income would put your household at the 20th percentile in the US.) Try a website like this to find the answer: https://howrichami.givingwhatwecan.org/how-rich-am-i.
Answer: You will have to enter both your income and household size. The average US household has 2.5 people: 2 adults and ½ a kid. The website allows only whole numbers of kids and I strongly advise against any Solomonic division of children. So try 2 adults and 1 kid, which will actually reduce per capita income. But such a household in the US is in the top 3.7% of income worldwide. At the federal poverty level, you would be at the ~80th percentile of the global distribution!
5. Why is the fertility declining so rapidly? Will the population of humans implode? How will that affect per capita incomes?
Population growth – not just economic growth – exploded after the Industrial Revolution. But after an initial surge, population growth began to slow. Most projections have predict population stabilization around 10-12 billion around 2085. After that, population is expected to decline, perhaps falling back to levels prior to the Industrial Revolution. This is illustrated in the figure below.
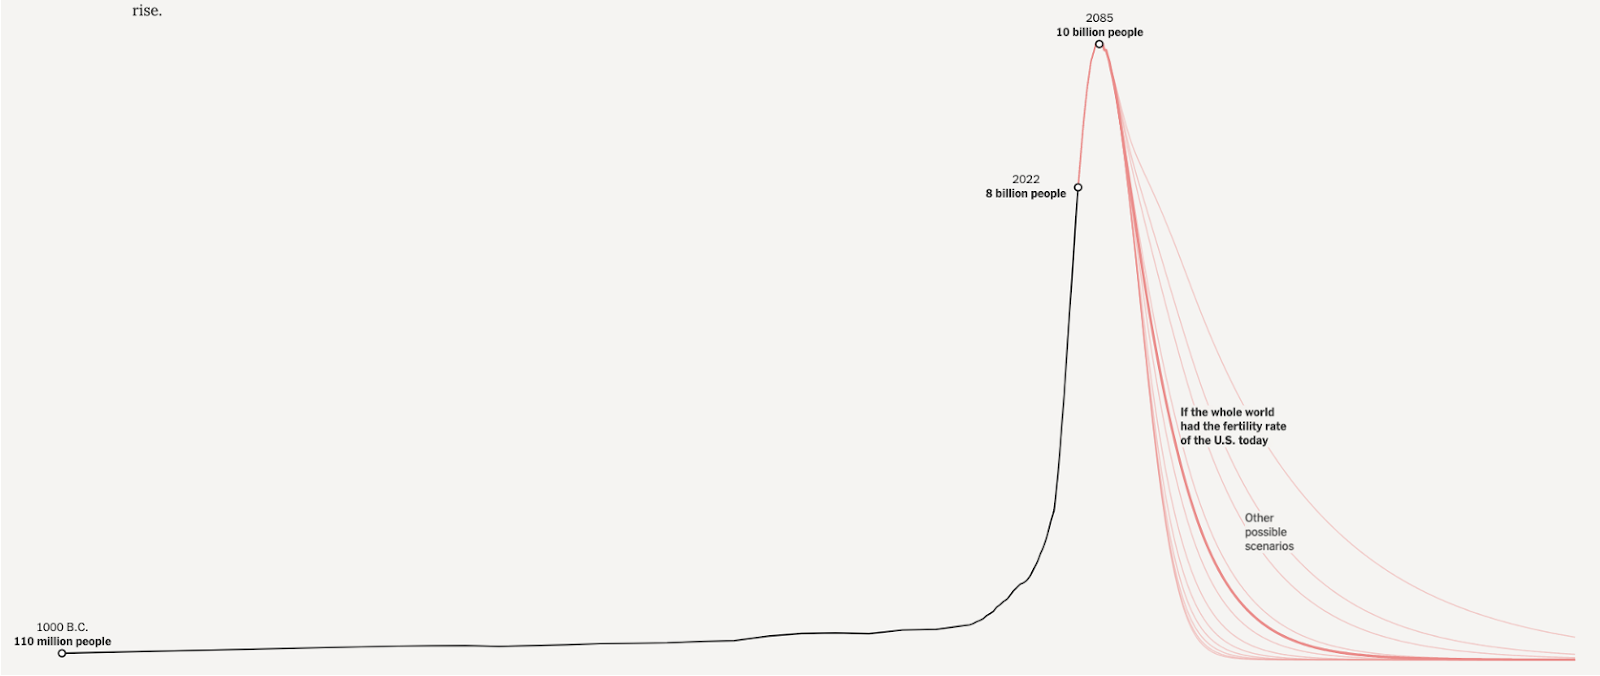
Notes: https://www.nytimes.com/interactive/2023/09/18/opinion/human-population-global-growth.html.
To understand why population exploded and stabilized one needs to understand the demographic transition. This transition has 4 stages, as illustrated in the left figure below. In the first stage, birth rates (number of births per person per year) and death rates (number of deaths per person per year) are high but the same. Population growth is zero because population growth (dp/dt) is equal to the difference between the birth rate (b) and the death rate (d): dp/dt = b - d.
In the second stage, death rates fall, causing population growth – and thus the population – to rise. This happened because the Industrial Revolution ushered in a period of human innovation. Some innovations increased the amount of calories and other goods humans could extract from the earth’s resources. But other innovations reduced the incidence of disease or cured disease. This reduced mortality rates.
In the third stage, birth rates fell. Why this happened is debated. Economists think that innovations from the Industrial Revolution increased hourly wages. That in turn increased the opportunity cost of time. Since childbirth and rearing require time, increased wages increased the cost of child-rearing. Moreover, the Industrial Revolution increased the returns to education because graduates could better use new technologies and earned more than non-graduates. This encouraged parents to spend more on improving the quality of their kids than the number of their kids. But non-economists suggest there are other causes. One is cultural changes that reduced the social value placed on having large families. Another is simply that humans have a target number of surviving progeny. When the death rate falls, humans can reduce the number of kids they have and attain the same number of surviving progeny. Of course, there may be a lag between when death rates fall and birth rates fall because it takes time for people to “believe” that death rates have really fallen. During this third phase, the population continues to grow, but at a slower rate. This is the phase that the world as a whole is currently in.
In the fourth stage, birth rates fall to the same level as the death rate and the population stabilizes. Some nations are already at this level, with rather stable populations. But many are still in the third stage, so the world as a whole is not expected to reach the fourth stage until about 2085.
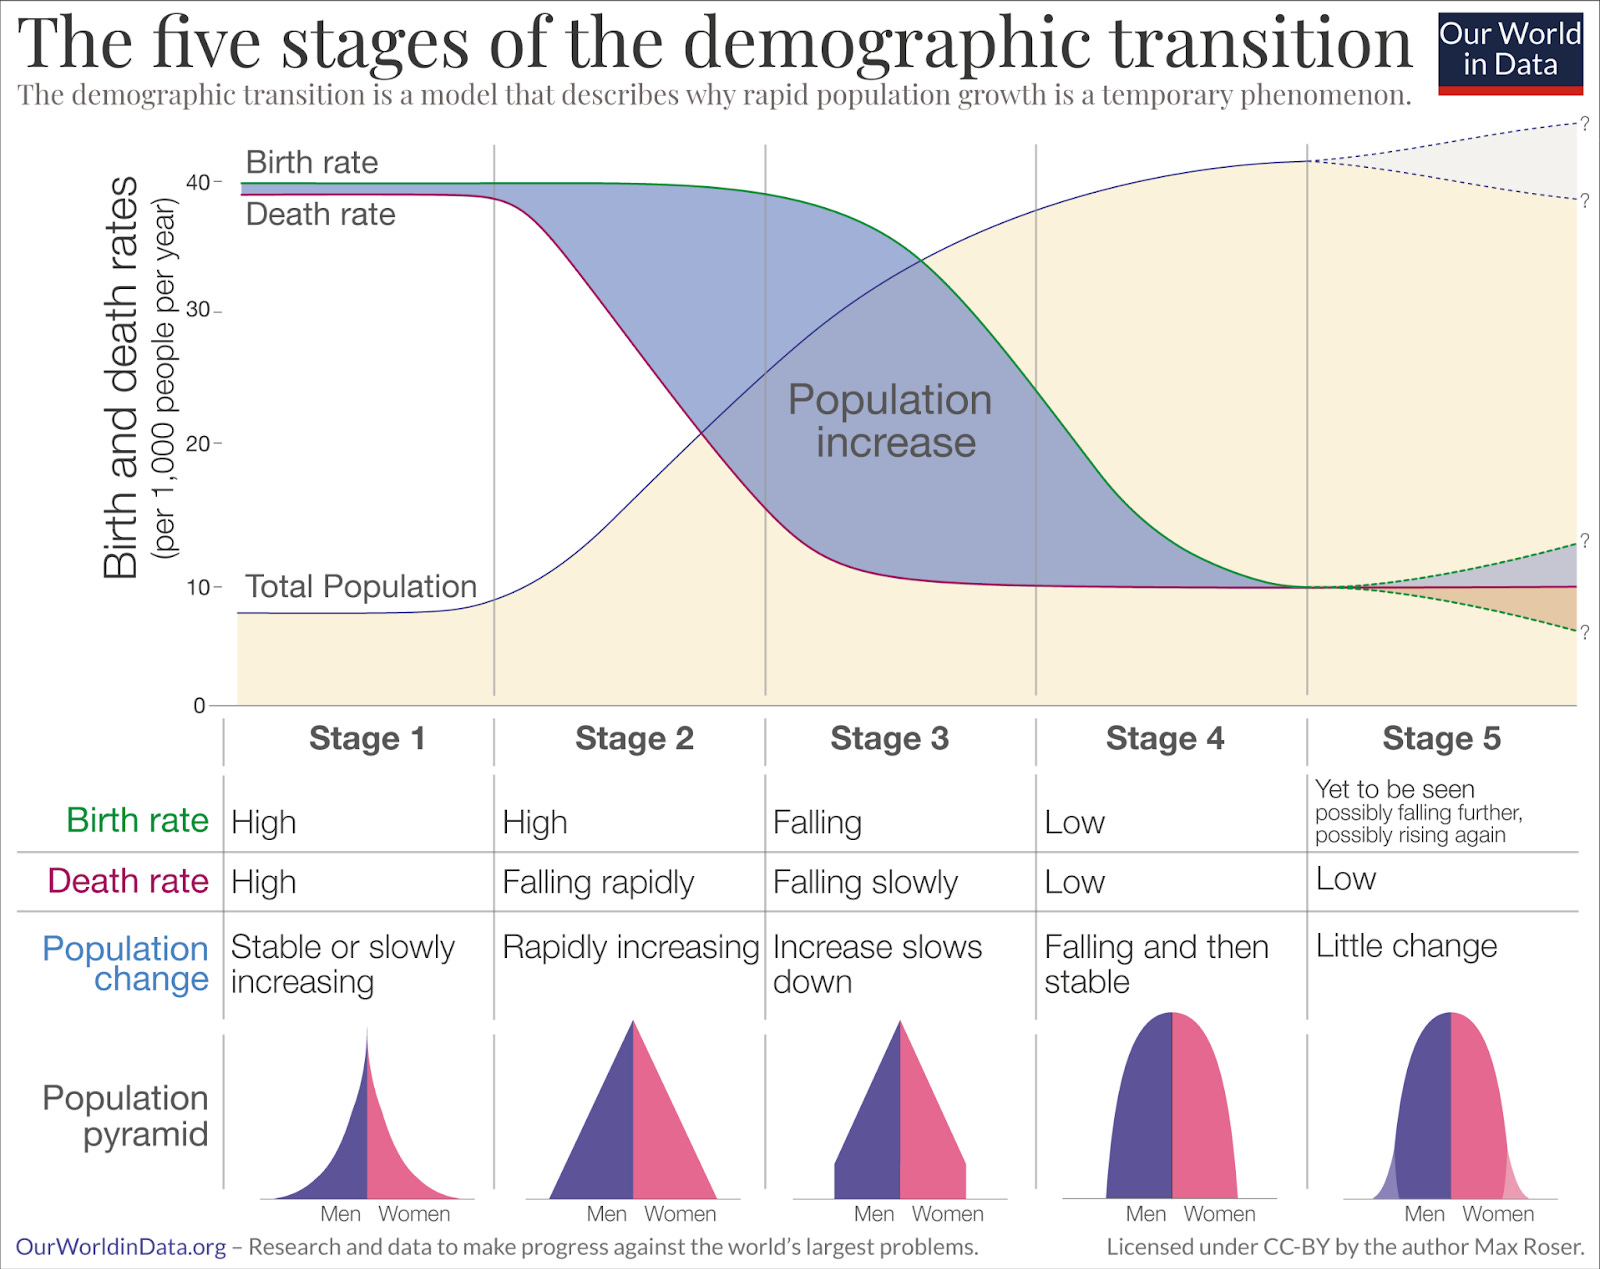
Note: Top subplot is from https://ourworldindata.org/demographic-transition. Bottom subplot is from https://ourworldindata.org/fertility-rate.
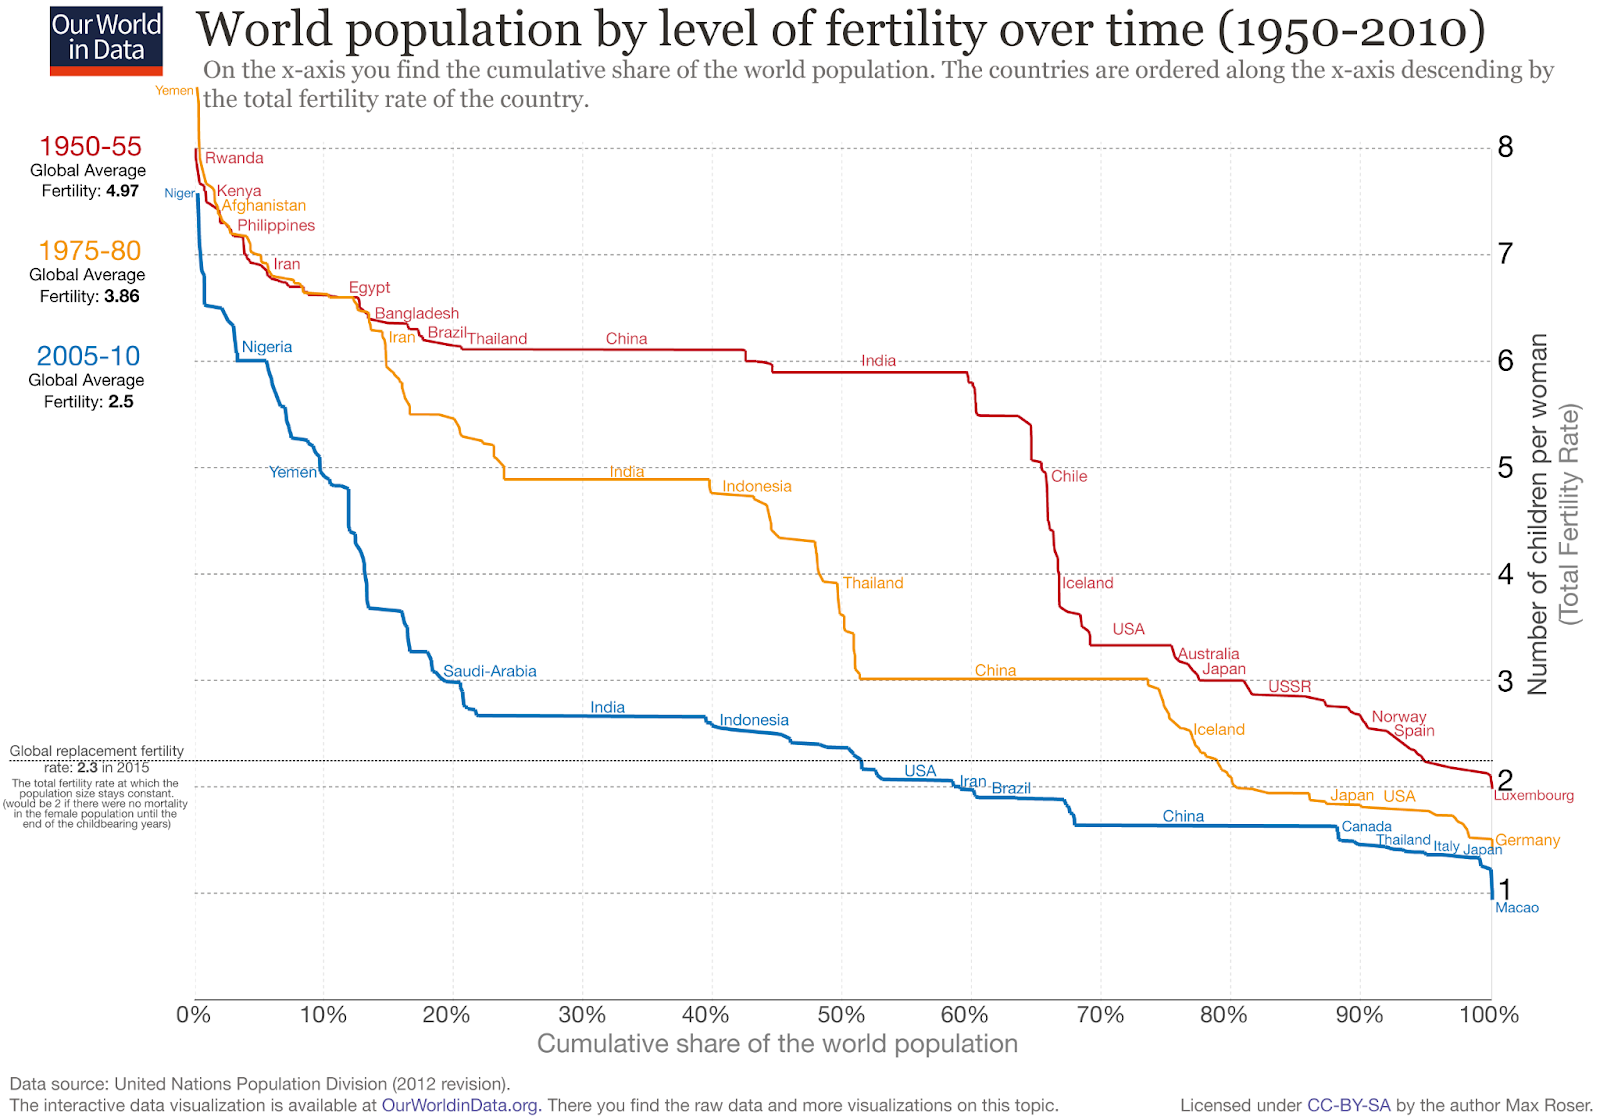
The problem we face is that there may be a fifth stage where birth rates (b) fall below death rates (d). This would cause the population to decline: dp/dt = b - d < 0. If this persists for long enough, we may undo all the population gains during the Industrial Revolution, as illustrated in the right figure above. In many countries, total fertility rate (TFR), defined as the number of children every woman has during her reproductive lifetime, has fallen below (roughly) 2. This is the TFP required to stabilize the population because females are one-half the population, so each female has to have (roughly) 2 children to replace all humans – male and female – that presently exist. (Actual replacement level is somewhat higher because some children may die before they themselves reproduce.) How realistic is this concern? Consider the figure below, which shows fertility rates across the world’s population during 3 periods (1950-55, 1975-80, and 2005-2010). Half the world’s population, including both the US and China, now have TFRs below replacement level. Other big countries, including India, are not far behind.
The big questions posed by this puzzle are: Why did fertility decline? Why has it fallen below replacement? Will TFR persist below replacement level? And what are the consequences?
Although demographic collapse is not a focus of this course, it is related to the Industrial Revolution – more precisely, to whether we live in a Malthusian or a neoclassical economy. If we lived in Malthusian economy, and there was no chance of losing all the technological knowledge we have attained since the Industrial Revolution, population collapse would lead to a jump in per capita income. The Industrial Revolution increased the Earth’s carrying capacity, and there will be fewer humans that have to split capacity: the pie has grown, but the number of people splitting it will fall, so each person gets a larger slice. But we live in a neoclassical economy in which more people is associated with higher per capita income. At the very least, growth in income would cease. If knowledge has to be used to be retained, we could even see per capita incomes fall as there are fewer people to do things and ideas are forgotten. If this seems far-fetched, ask yourself how many people know how to use slide rules now that we have calculators or how many people know how to navigate using the sun and natural signposts now that we have GPS.
6. Has the pace of innovation slowed? Why is that?
The final puzzle is whether and why the innovation has slowed. Innovation – specifically, the ability of humans to innovate – is a key distinction between the Malthusian (or classical) era and the new-classical era. In the former, more humans largely meant fewer resources for everyone. In the latter, more humans tend to lead to more resources for everyone. So if the pace at which humans innovate slows, we may experience slower future growth in consumption or, worse, a return to the Malthusian era.
A simplified framework for how to think about this (from Bloom et al. AER 2020) is:
Economic growth = research productivity x number of researchers
If research productivity is falling, then we have to keep increasing the number of researchers in order to sustain growth. But there is a limit to how many researchers we can have (the entire population!). When we reach that point, lowering productivity has to lower economic growth.
Unfortunately, it appears that productivity has been declining for decades. The top figure below shows that, while overall productivity growth across the economy has been constant, the number of researchers has been growing steadily. This implies the bottom figure, which shows research productivity over the last century
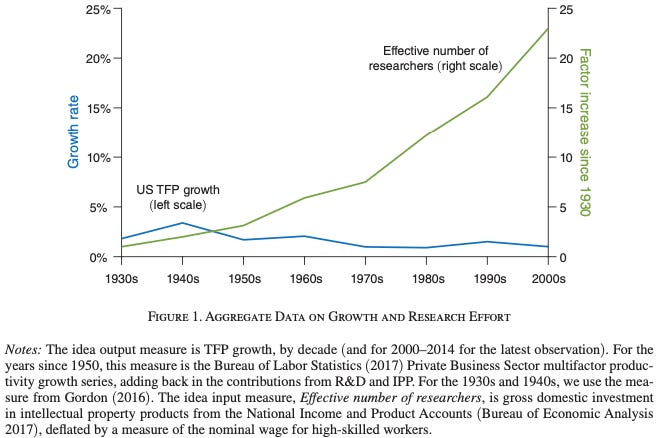
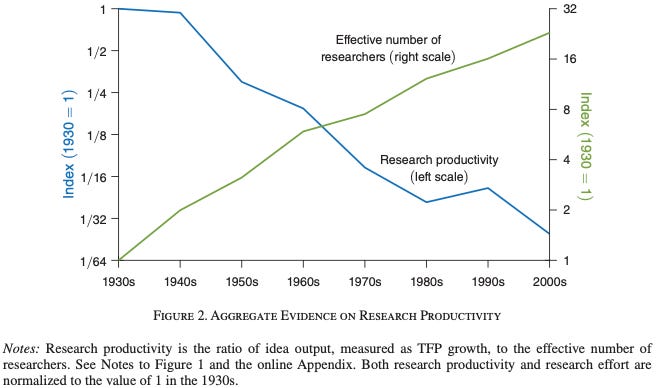
Notes: From Bloom, Nicholas, Charles I. Jones, John Van Reenen, and Michael Webb. 2020. 'Are Ideas Getting Harder to Find?', American Economic Review, 110: 1104-44.
There are many reasons why productivity may be slowing. The most common explanation is that all the low-hanging fruit have been picked and new ideas take more time. Another explanation is that research is becoming more bureaucratic and costly. A third possibility is that the returns to other professions – law, finance, etc. – is diverting talented people away from research.
When this problem is combined with the fifth one – declining population growth – the forecast for growth becomes more dour: not only is the productivity of researchers falling, but the number of researchers may fall as the population does.
Why are we exploring these puzzles in a Law and Economic Development class?
Before I dive into these puzzles, you might ask: what does this have to do with “law”? The title of this course (Law and Economics Development after all suggests that law is a central topic of our discussions. There are three parts to my answer. First, law, defined as long-term institutions and short-term policy, is relevant to the answer to parts 2 and 3. When exploring differences in the economic performance of countries today, one of the causes we will explore is historical institutions, including things like property rights protection, state institutions, and political participation. These are historically shaped by laws – rules that regulate the behavior of a society’s members.
Second, economic policies – such as trade and organization of the financial sector – can have major impacts on outcomes. But these policies are actually implemented by statutes, i.e., laws. This answer really gets at what we mean by “law” in modern universities and professions. Are law schools just teaching people how to create laws or to help people follow them? If the former, then this second answer is adequate. Lawyers should care about policy-making as much as students in public policy school. If the latter, then this second answer will be unsatisfactory. You rightfully will say this course belongs in the policy school.
The reality is that lawyers – in addition to helping people comply with laws – also help develop laws. (For example, most people in Congress are lawyers. As are many of our Presidents.) And the process is of policymaking looks something like: domain experts → lawyers as drafters of statutes and political representatives voting on laws → non-legal bureaucrats implementing laws → lawyers helping ensure parties are compliant. Even with a limited view of what role lawyers play, it seems reasonable to think lawyers may want to learn about policy. (Indeed, almost all law school classes are premised on this view. For example, an antitrust or employment law class will constantly ask, does this statutory or common law rule make policy sense?)
Third, sometimes the answer is, not much. And that is important to know if your prior belief is that law matters to economic development. I think that many (most?) people think: the rule of law matters to economic flourishing. Many also think property rights and political participation are important. But what if they aren’t? I am not saying that it isn’t (and don’t think it is entirely true that law is irrelevant). But we will see evidence suggesting that it is at least of second-order importance. Perhaps our current policies and laws may be the outcome of historical events or geography and not something we can really manipulate. Or laws may be largely irrelevant. For example, it might be reasonable to argue that: either your country either has large plains fed by rivers for agriculture to support a large population, and perhaps with ports for trade, to promote specialization, or your country is fighting an uphill battle to develop. Knowing that law is of second-order importance is itself important for lowering the temperature in legal debates.
References
Bloom, Nicholas, Charles I. Jones, John Van Reenen, and Michael Webb. 2020. 'Are Ideas Getting Harder to Find?', American Economic Review, 110: 1104-44.